Plotting
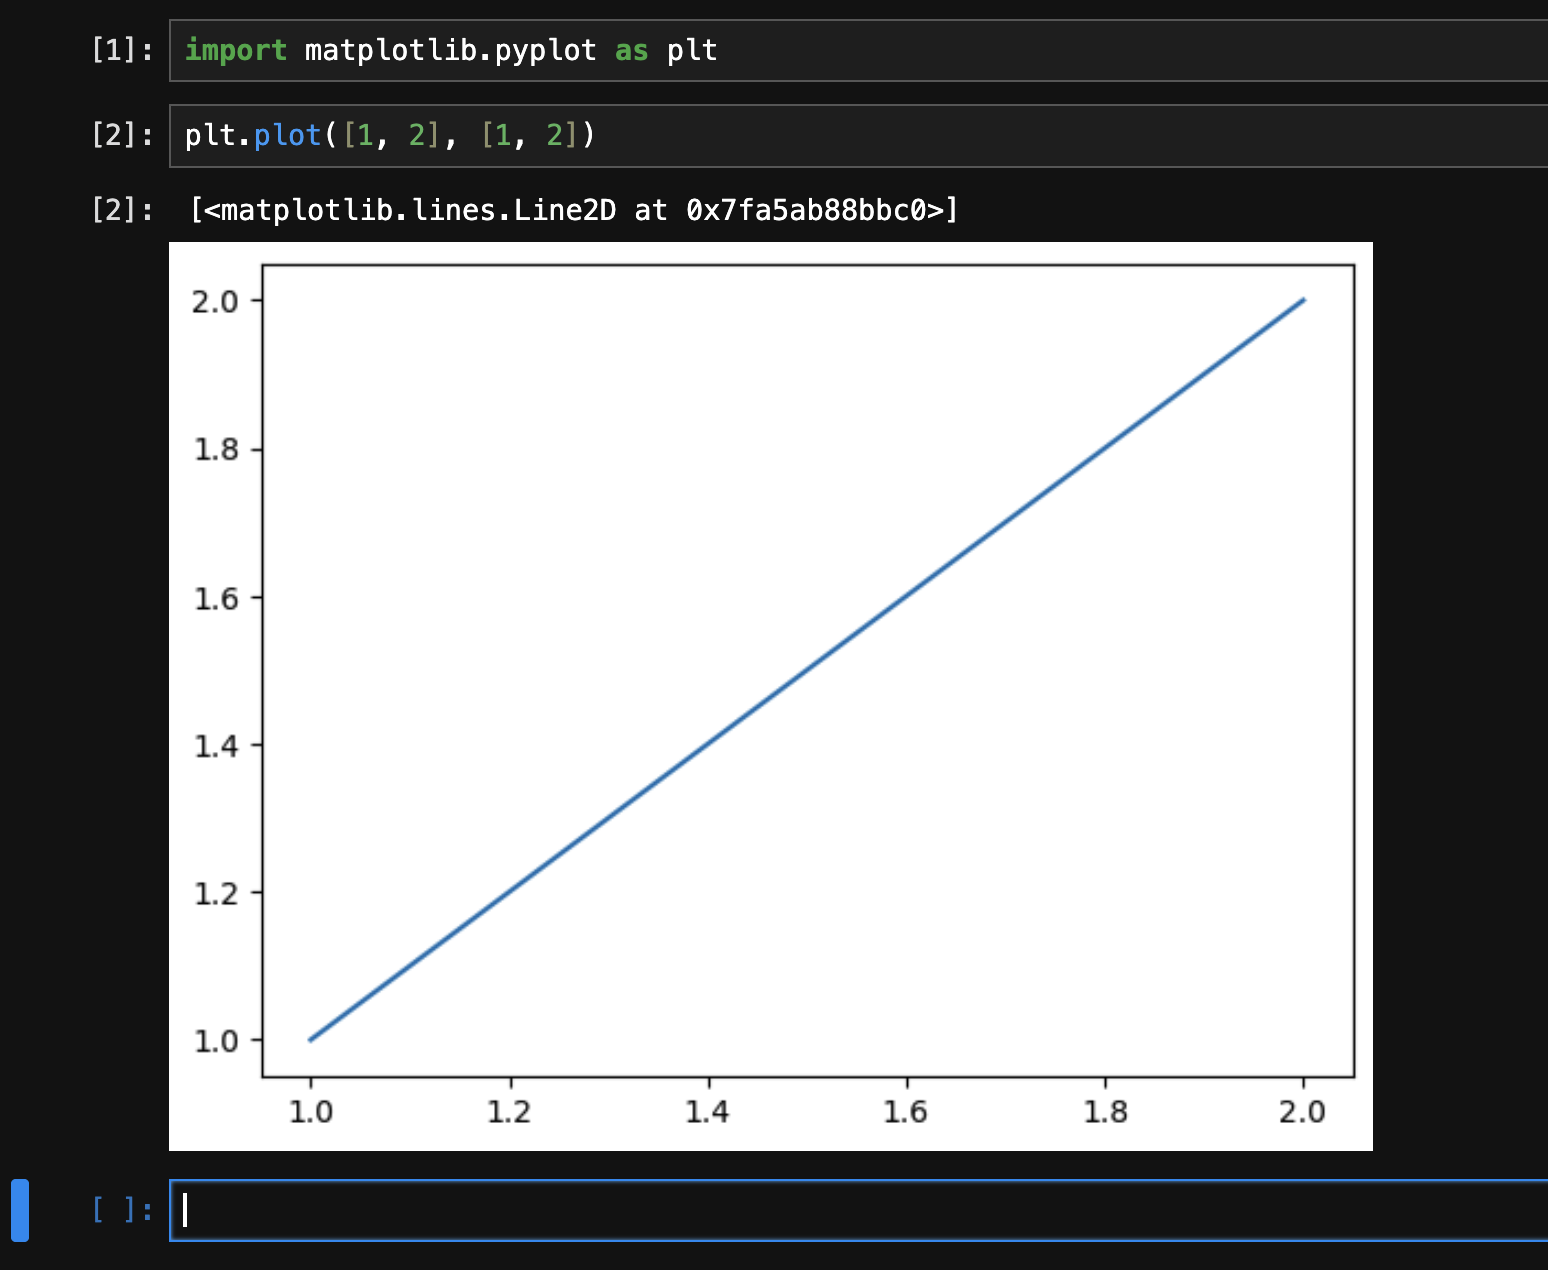
The JupyterHub environment does not allow to use matplotlib or other plotting libraries interactively. You can use inline plotting in Jupyter notebooks normally while you are exploring the dataset.
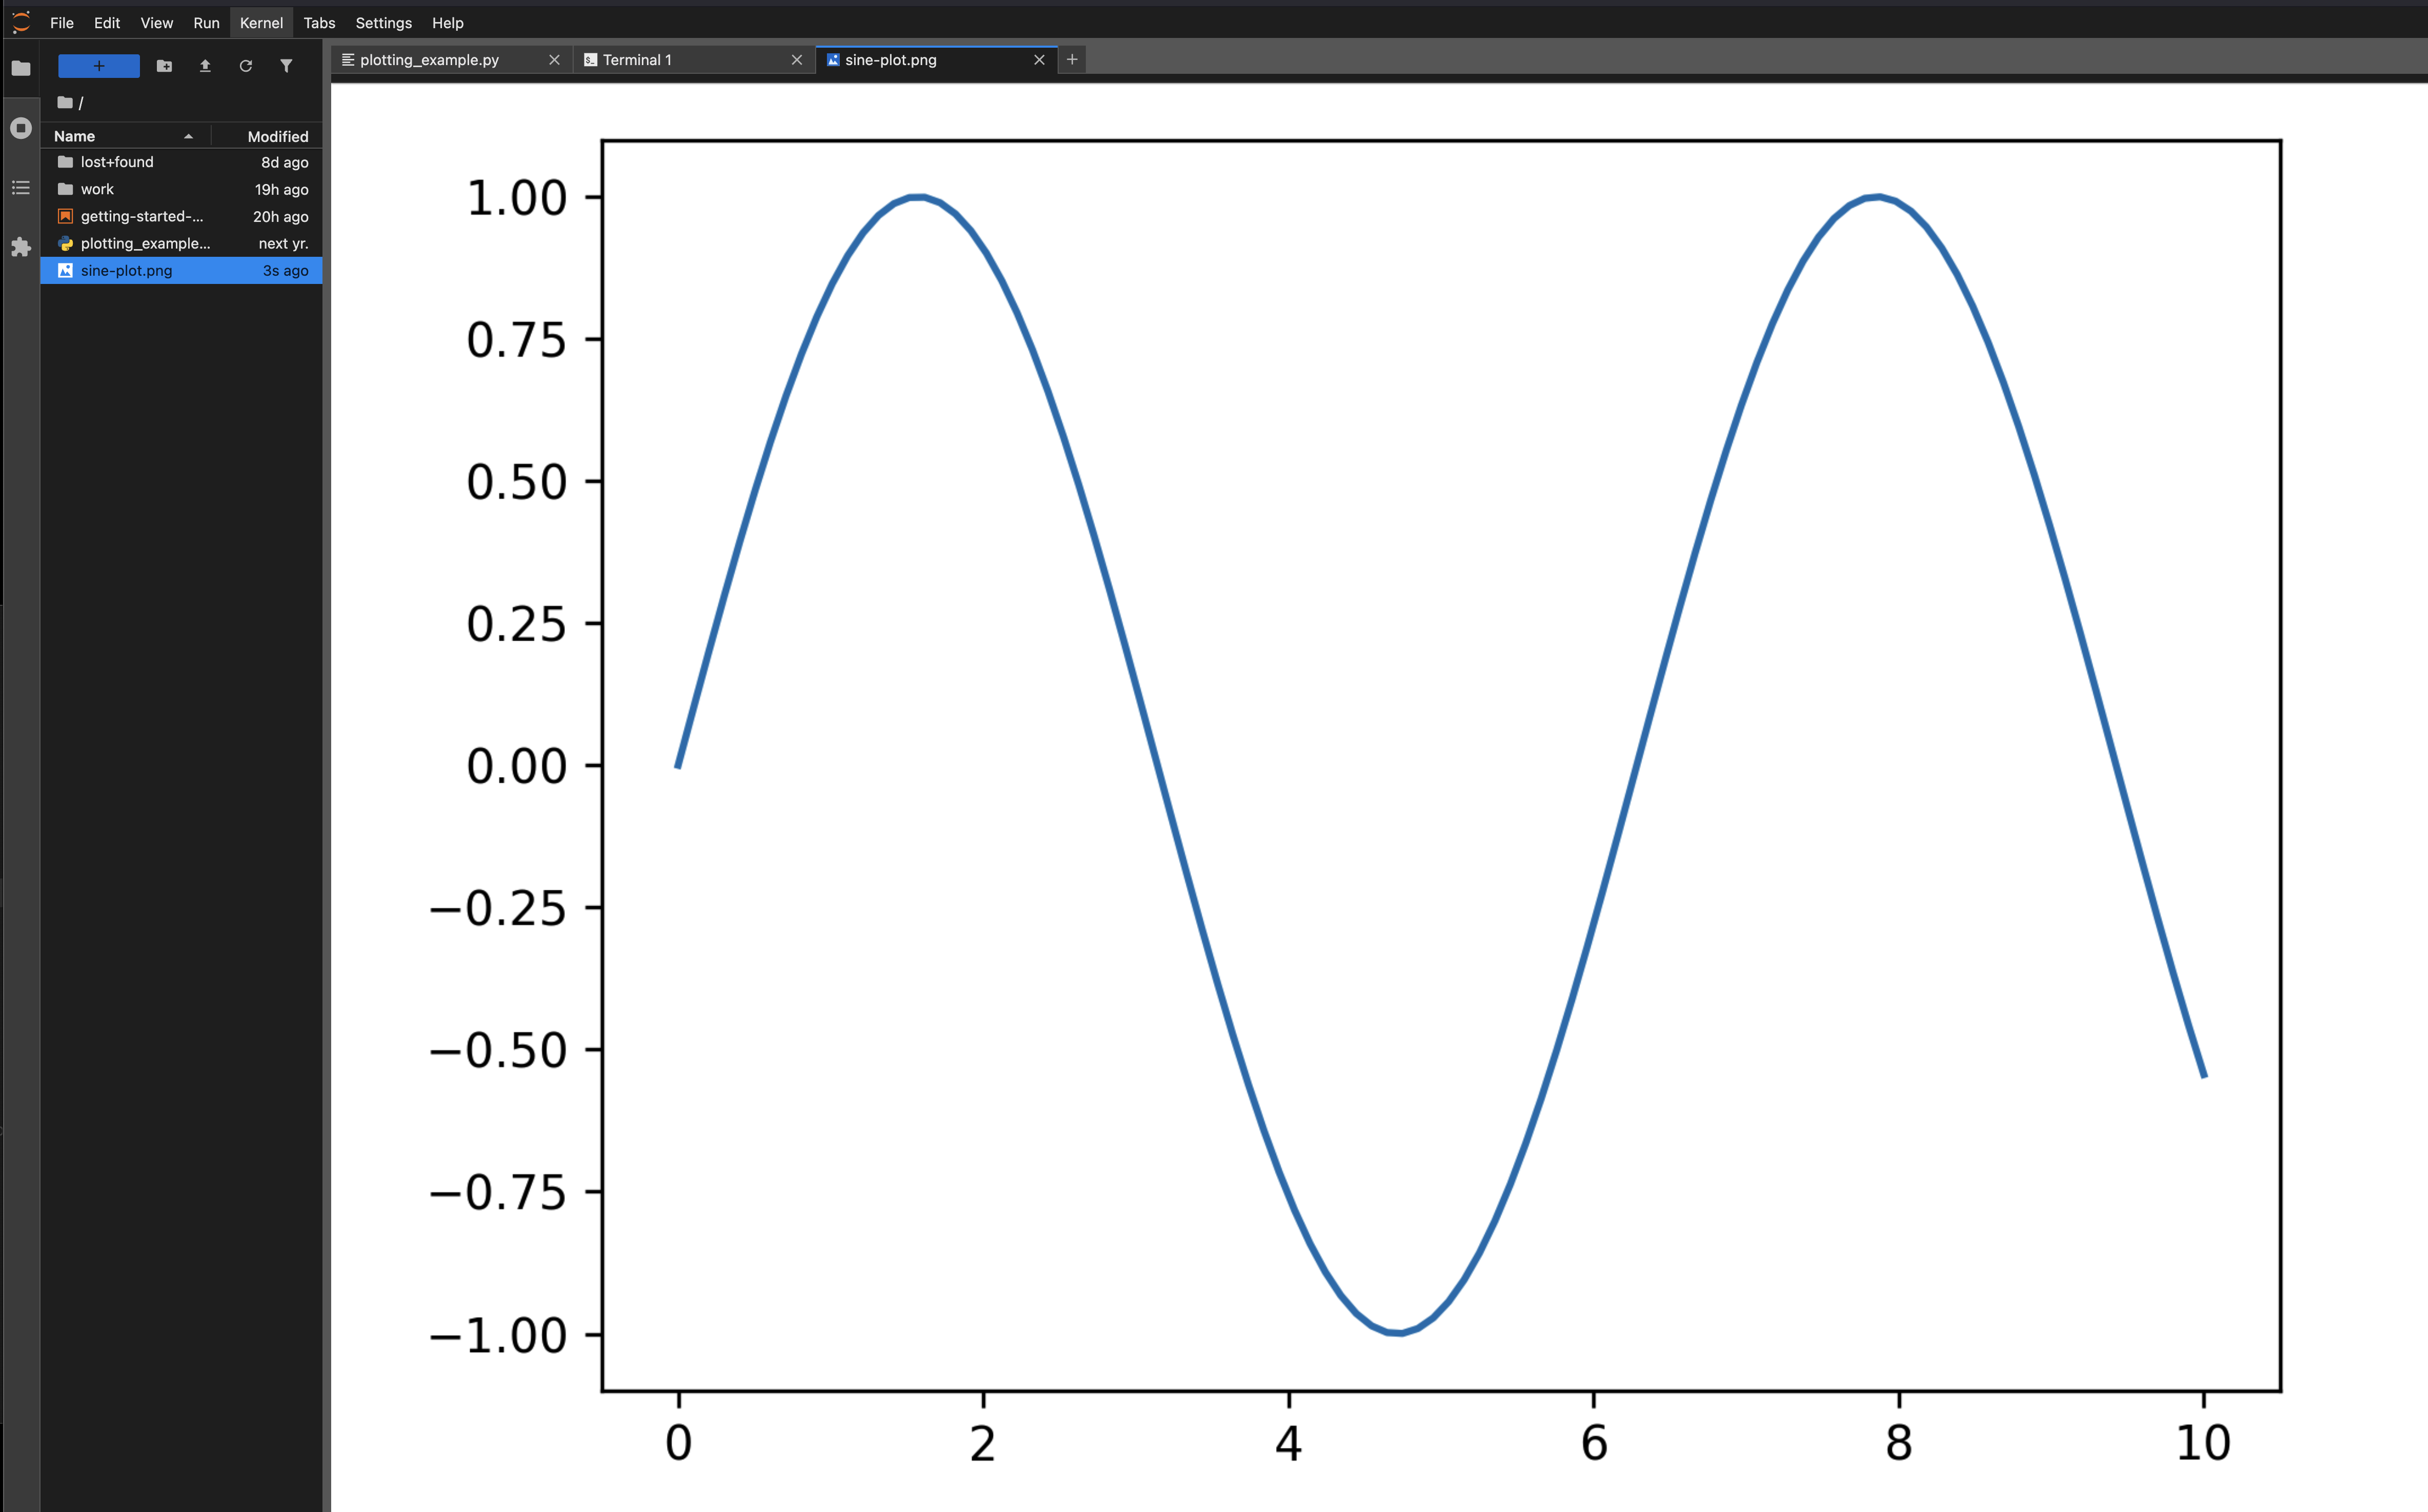
From a Python file, you can instead save plots to a file using the savefig method. For example, create a new Python file with the following code and save it as plotting_example:
import matplotlib.pyplot as plt
import numpy

x = numpy.linspace(0, 10, 100)
y = numpy.sin(x)

plt.plot(x, y)
plt.savefig('sine-plot.png', dpi=300)
In a terminal run the following command:
python plotting_example
Now you can open the PNG file from the file explorer. You can overwrite this file as many times as necessary and reload it to see the changes.